Reviews
Part of 4 things nobody tells you about thirteen electric home upgrades worth considering
After an electric home upgrade: baseline, weather normalization, and reading the result
A method for judging an electric home upgrade after installation: baseline usage, weather normalization, and reading results honestly, converting to money last.
Most households judge an upgrade by whichever bill arrives first, which is close to the worst available method. A single month compares two different weather patterns, two different occupancy patterns and two different rate periods, then attributes the whole difference to the new equipment. This article sets out a comparison that survives scrutiny.
What to take away
- Capture a baseline before the work, because it cannot be recovered afterwards.
- Compare energy use, not money, until the very last step.
- Normalize for weather or the comparison means nothing.
- Give it a full heating season and a full cooling season.
Step one: the baseline you cannot recreate later
Download twelve months of usage from every fuel account before the crew arrives. Usage, not cost. Note the equipment being replaced, its age, and anything else changing in the same period: a new occupant, a home office, a different work schedule.
Write down what you expect to happen and by roughly how much. Recording the prediction in advance is what stops the result being reinterpreted to fit whatever happened.
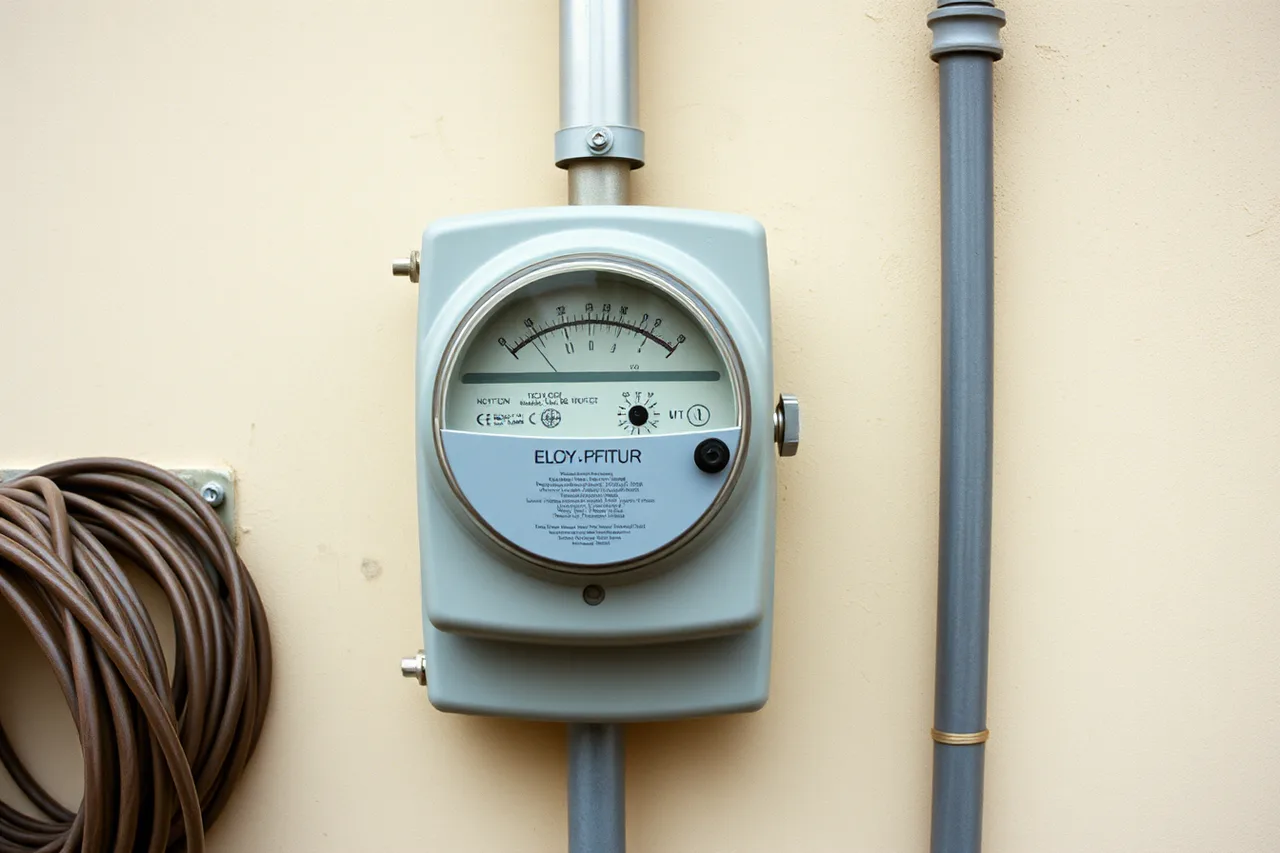
Photograph the meter reading on the day the work starts, and again on the day it finishes. Utility billing periods rarely align with installation dates, and those two readings let you cut the partial month cleanly instead of arguing with a bill that straddles the change.
Step two: units, then normalization
Fuel switching makes raw comparison impossible without conversion, because therms and kilowatt hours do not compare directly. The EIA's energy conversion calculators handle that arithmetic and are the standard reference for putting two fuels on one basis.
Then normalize for weather: divide heating-season energy use by heating degree days for the same period, and cooling-season use by cooling degree days.
A ratio of energy per degree day is comparable between years, unlike raw totals. Without this step, a mild winter can invent a saving that does not exist or hide a real one.
Step three: read the result honestly
Read the result honestly
| What you find | Most likely explanation |
|---|---|
| Large saving, first month only | Weather, not equipment |
| No change after weather adjustment | Control settings or duct losses, check before blaming equipment |
| Electricity up, total energy down | Expected after fuel switching; compare on a common basis |
| Winter spike in a heat pump home | Backup resistance heat, check the lockout configuration |
| Improvement in comfort, none in energy | A real result, and a common one |
That last row deserves respect. Comfort improvements are genuine outcomes even when the energy number is flat, and pretending otherwise leads households to rip out equipment that is doing its job.
Step four: put it in context
Long-run national data helps sanity-check your own result. EIA's Residential Energy Consumption Survey shows energy consumption per household declining over time. That slow, broad trend comes from equipment, envelope and appliance changes across the housing stock.
If your single upgrade appears to beat that trend by an order of magnitude, check the arithmetic before celebrating.
Only at the end convert to money, using your actual tariff for both the before and after periods. Rates change independently of your equipment, and mixing a rate change into an equipment comparison is the most common way a good result gets misread.
For what other households notice after the work, see our piece on what owners actually report; the upgrade field itself is listed in the thirteen upgrade types.